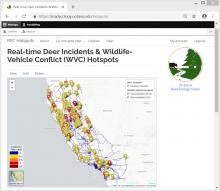
States increasingly maintain databases of wildlife-vehicle conflict (WVC), including locations of carcasses and crashes involving animals. Once these data are collected, a common and expensive barrier before they can be used in safety and environmental planning is identification of “hotspots” of incidents (here defined as locations of high-rates and/or statistically-significant clusters). We have pioneered app and web-based reporting and visualization systems for carcass and crash data for California. With support from the Pacific Southwest Region University Transportation Center, we developed a web-based analytical environment that state DOTs can use to automate certain analyses of WVC hotspots in order to inform planning to improve driver and wildlife safety. The system is available to DOTs through REC servers with private or public facing features and usability. The system uses data prepared and uploaded by the user, in spatial (shapefile), or spreadsheet (.xls, .csv) form, to automatically identify and locate road segments with high densities or statistically-significant clusters of WVC. Once analysis is complete, the user receives an output shapefile showing incidents and hotspots, various charts of results, and a "mini'GIS" useable in a browser. In California, the systems also automatically ingests and uses data from web-based sources. We coninue to work with state DOTs and their wildlife agency partners to ensure that the features are generally usable for DOTs.
Automated Analysis of Wildlife-Vehicle Conflict Hotspots Using Carcass and Collision Data
Project Status
Completed Project
Program

