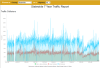
These graphs traffic volume on select California highways, between March 10, 2020 and April 12, 2020. The top graph features several major highways, while the bottom graph smaller state routes.
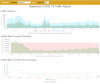
These graphs show the crashes where the California Highway Patrol responded, between March 1, 2020 into April, 2020. The top graph shows the number per day of all crashes and number of collisions/day where an injury/fatality occured. The bottom graph shows all crashes by area. In both graphs, the spike in crashes between 4/5 and 4/10, including injury/fatality crashes, was possibly due to heavy rains in the Los Angeles and San Diego areas.
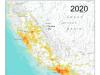
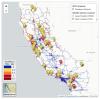
The Governor's order for "shelter-in-place" in response to the COVID-19 pandemic went into effect on 3/20/2020. These maps show the hotspots for injury and fatal accidents on state highways and certain major roads patrolled by the California Highway Patrol for 3/21-3/30/2019 and the same period in 2020. Use the slider to see the injury accident reduction in 2020 compared to the previous year.
Real-time Deer Incidents & Wildlife-Vehicle Conflict (WVC) Hotspots map, with live data feeds from the California Roadkill Observation System (CROS) and the California Highway Incident Processing System (CHIPS).
This map shows SR 37 under different Sea Level Rise conditions and timeframes. It shows the level of water inundation and how certain parts of the highway will be submerged. Click on the map menu below to select overlay layers. More tips below the map.